Industrial Data Visualization

Enterprise-grade dashboarding solution developed for ArcelorMittal. Replaced legacy Excel workflows with a Python/Streamlit pipeline, enabling real-time monitoring of wire-drawing parameters (tension, temperature, speed).

Python 3.9 Streamlit Pandas Plotly
View Case Study
DataViz Dashboard
Enedis Data Challenge
// DATA SCIENCE & ML

Enedis Data Challenge

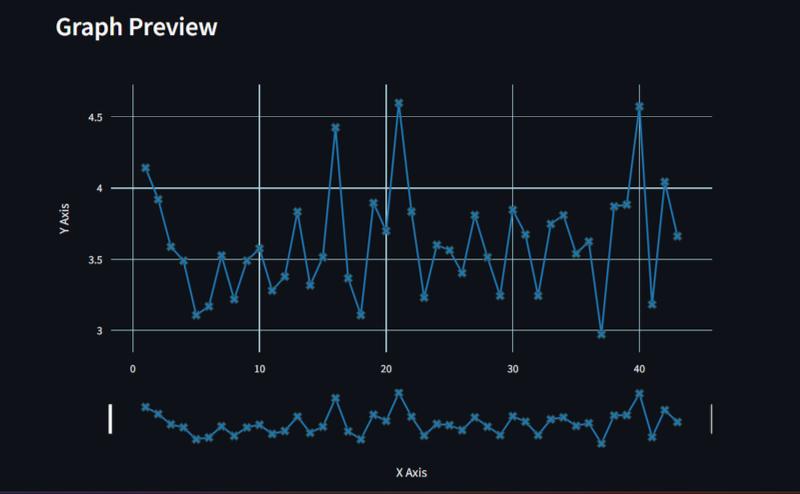
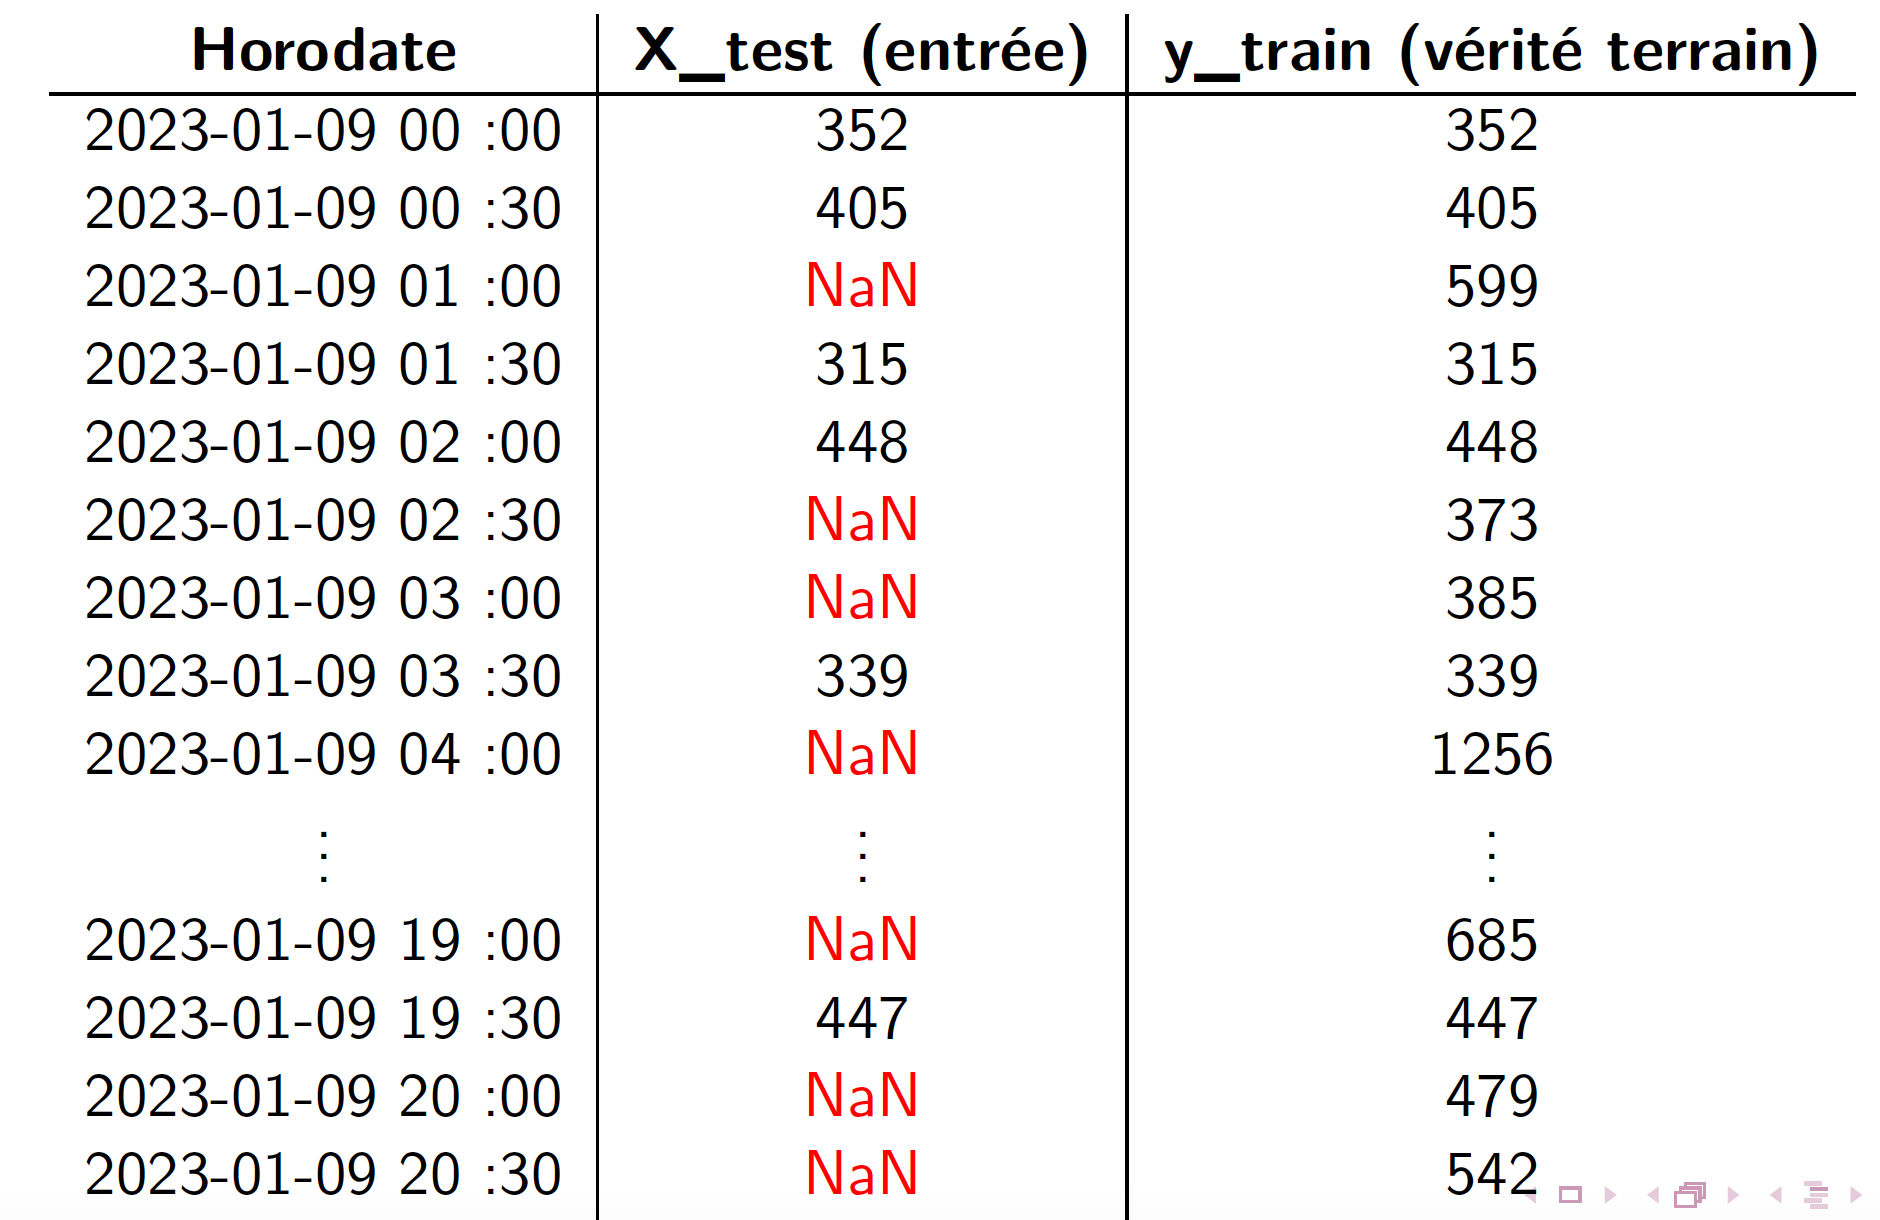
Time-series imputation for electricity consumption. Implemented Cyclic k-NN and SoftImpute Matrix Completion.

Python Scikit-Learn Pandas
View Case Study
Factory Simulation
// SIMULATION

Factory Sim Engine

Python-based serious game modeling production chains. Optimized inventory logic and queue management algorithms.

OOP SimPy Gamification
View Case Study
Frisbee Dynamics
// IOT & MECH

Flight Dynamics & IMU

Instrumented frisbee with embedded IMU sensors. Aerodynamic modeling to predict trajectory and optimize stability.

C++ Sensors Physics
View Case Study
Prosthesis
// BIOTECH

Shoulder Implant Design

Finite Element Analysis (FEA) of the glenoid component. Analyzed contact mechanics to prevent loosening.

FEM Analysis Biomechanics
View Case Study
Automotive Jack
// CAD DESIGN

Automotive Jack Design

Complete mechanical sizing and material selection (Ashby method) validated by static structural simulations.

CATIA V5 Materials
View Case Study